Underwater Acoustic OFDM/QPSK Communication: Signal Structure and Channel Characterization from a Lake Trial
List of Figures (12)
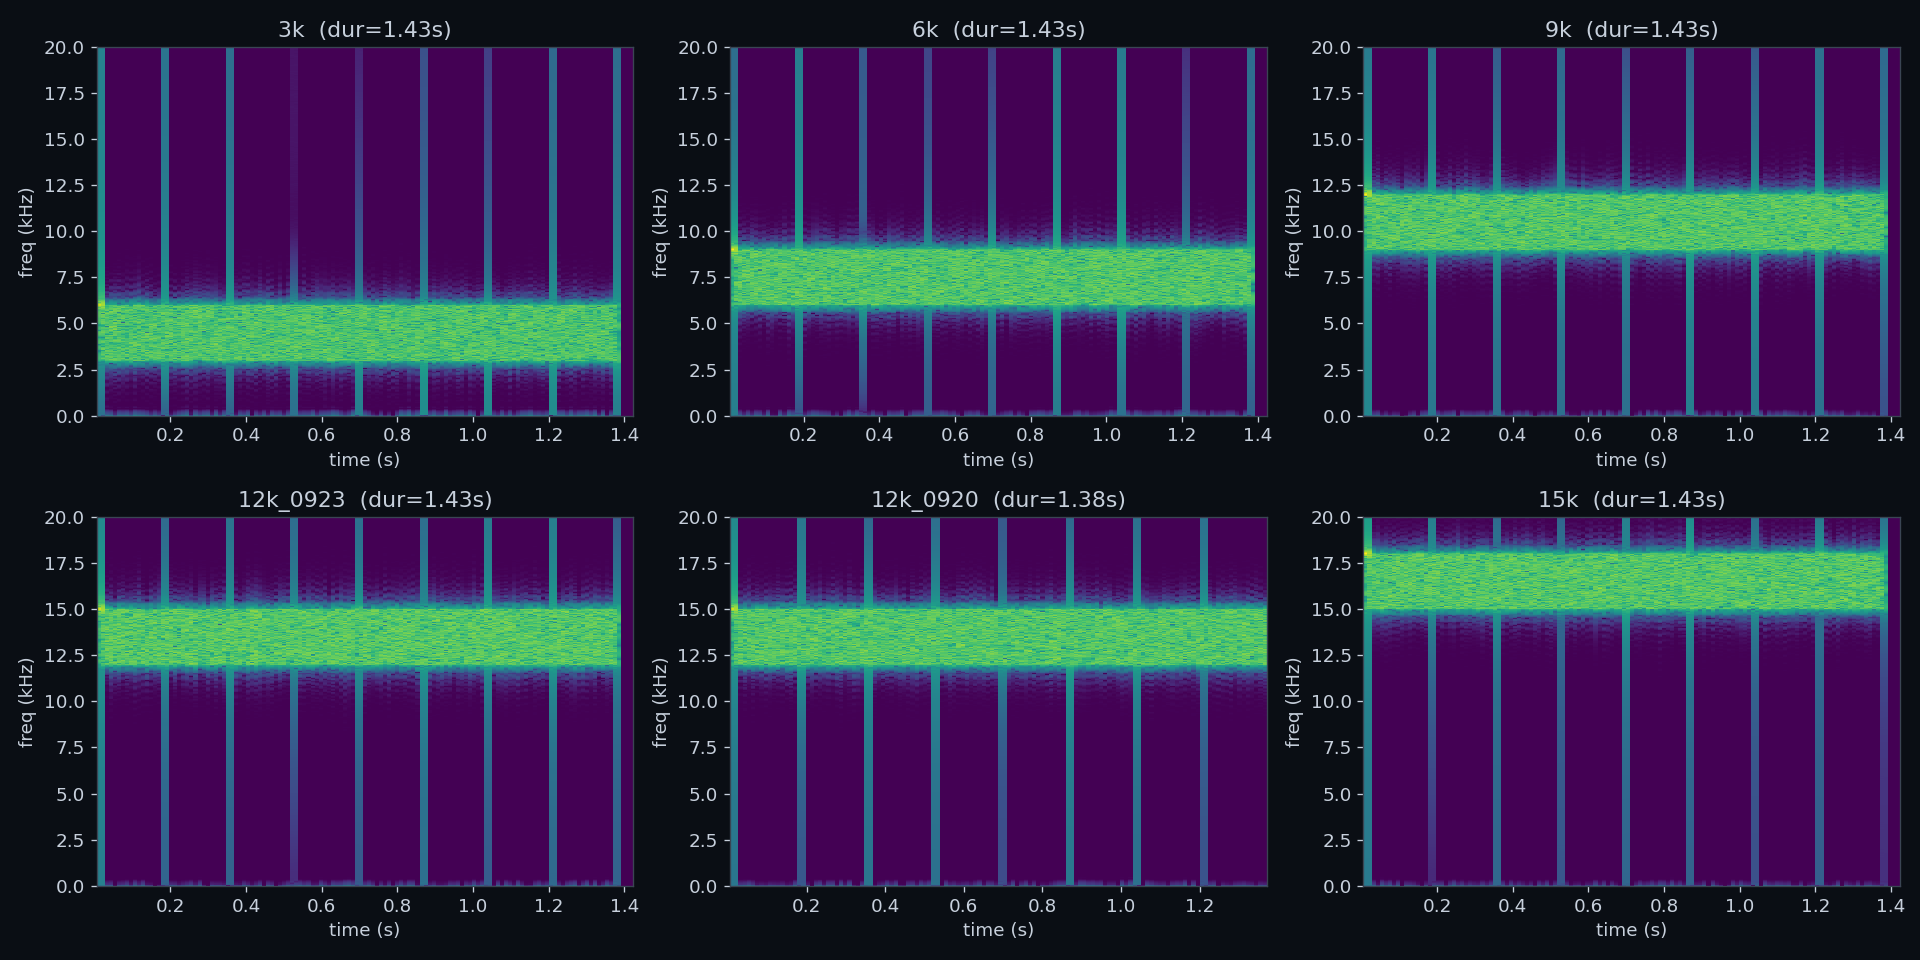
- Figure 1: Spectrograms of the six transmitted reference bursts
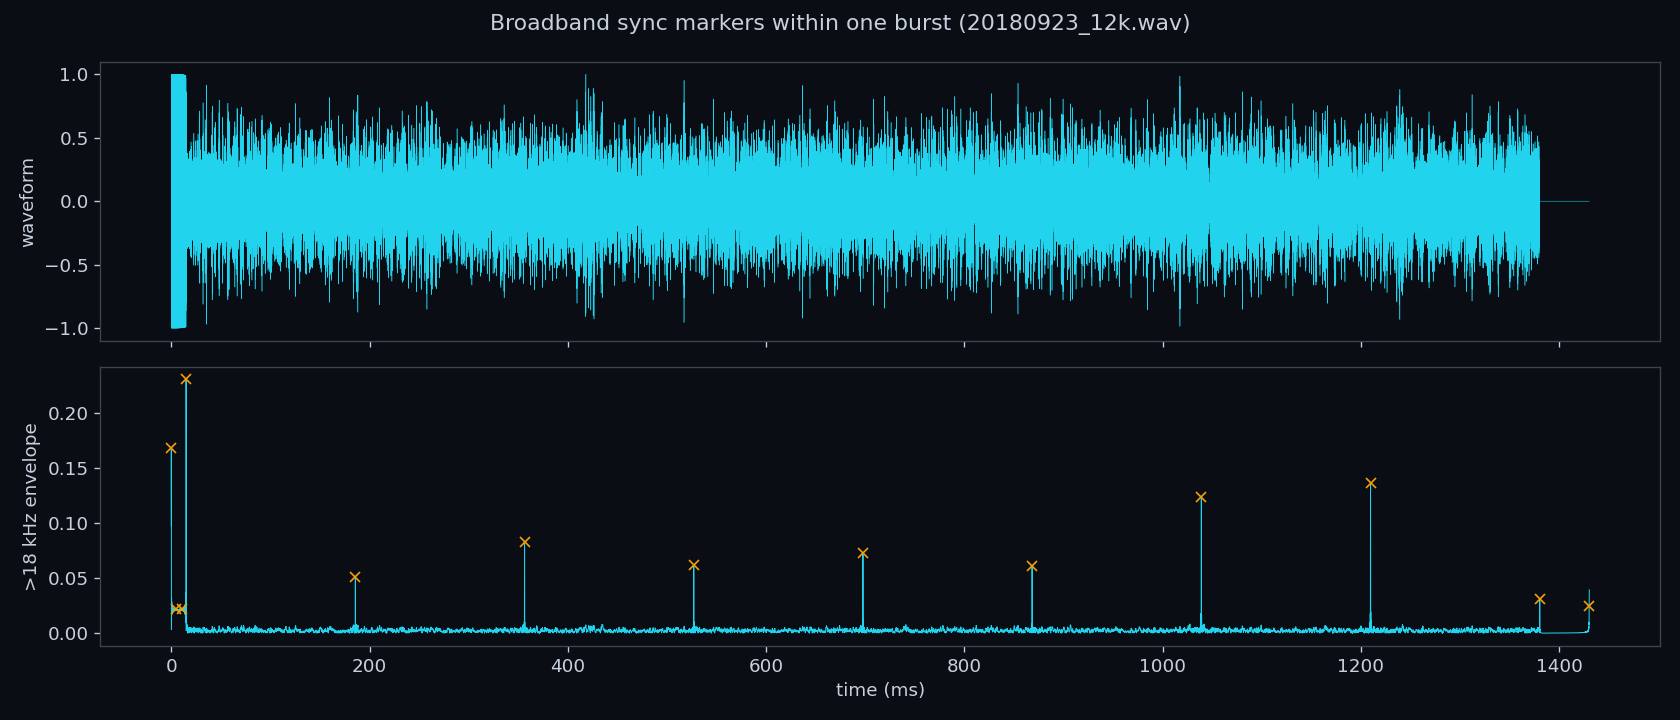
- Figure 2: Broadband timing markers within one burst
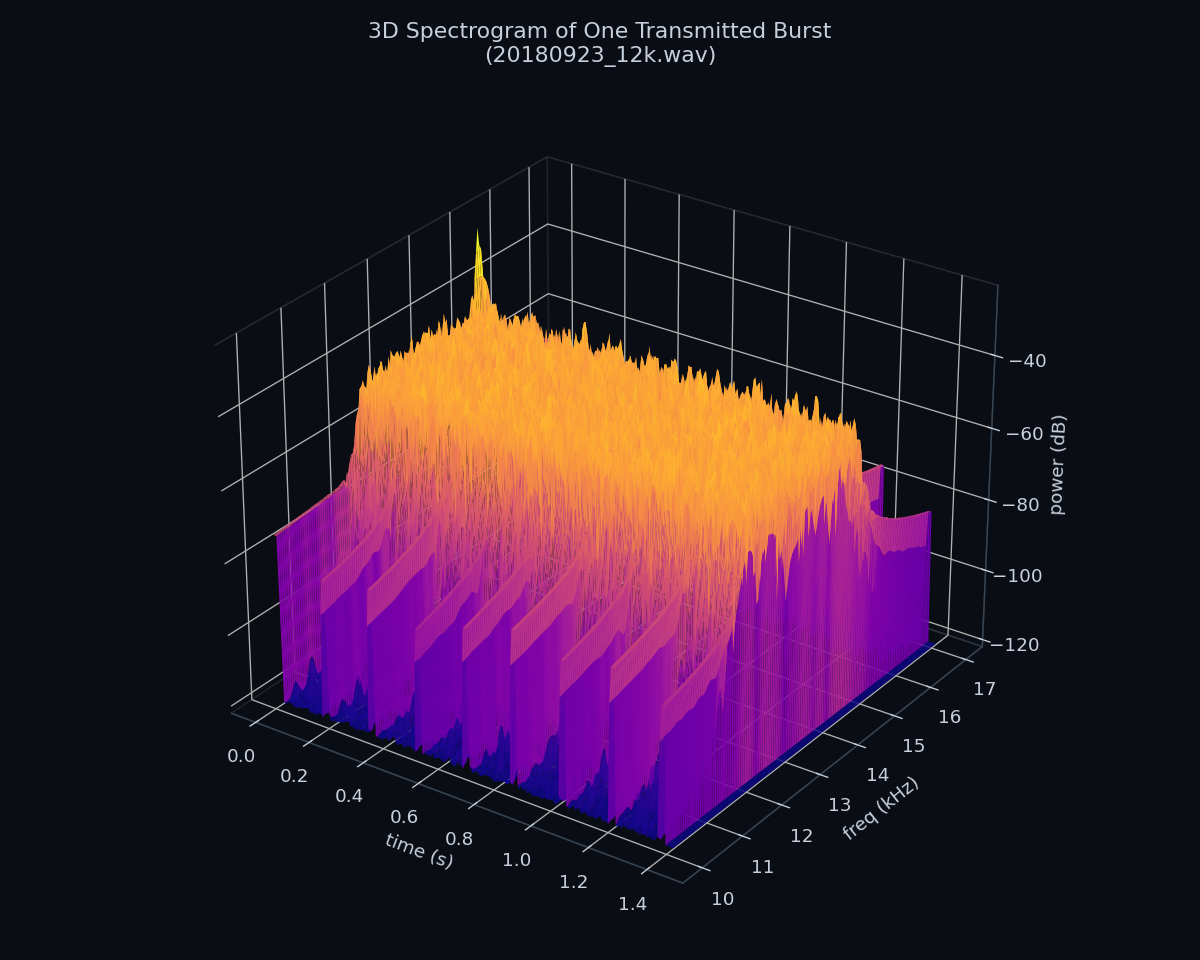
- Figure 3: Three-dimensional spectrogram of one transmitted burst
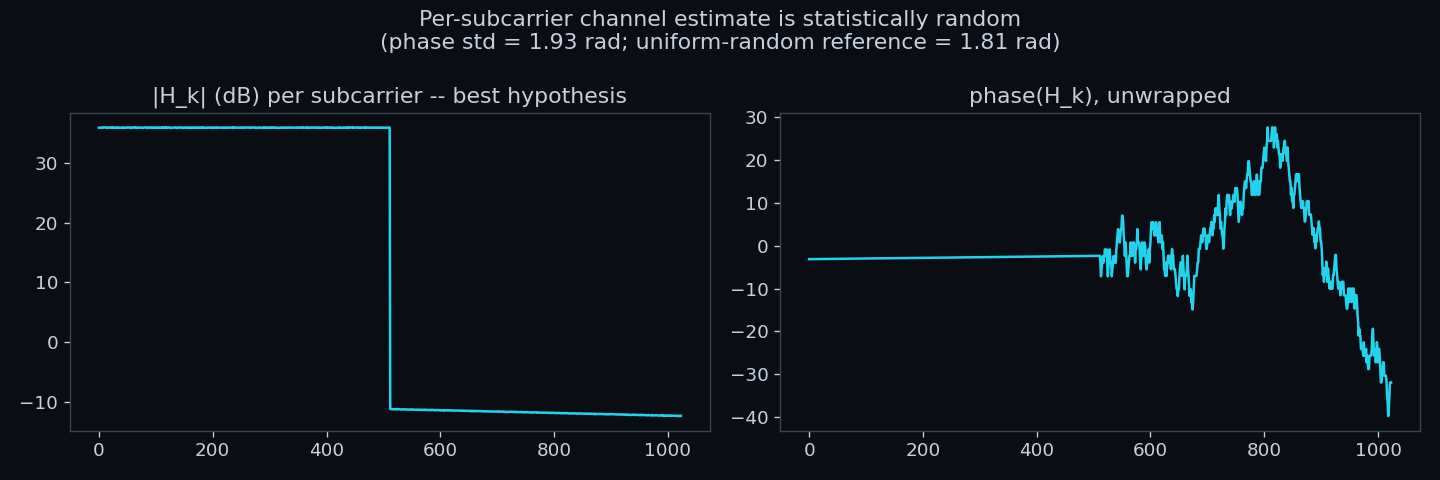
- Figure 4: Per-subcarrier channel estimate for an evaluated candidate model
- Figure 5: Demodulated constellations for all six transmitted bursts
- Figure 6: Band-limited RMS envelopes, group 6 recording
- Figure 7: Sequential band-hopping protocol, three-dimensional view
- Figure 8: Measured signal-to-noise ratio per frequency band
- Figure 9: Channel estimate from the real received recording
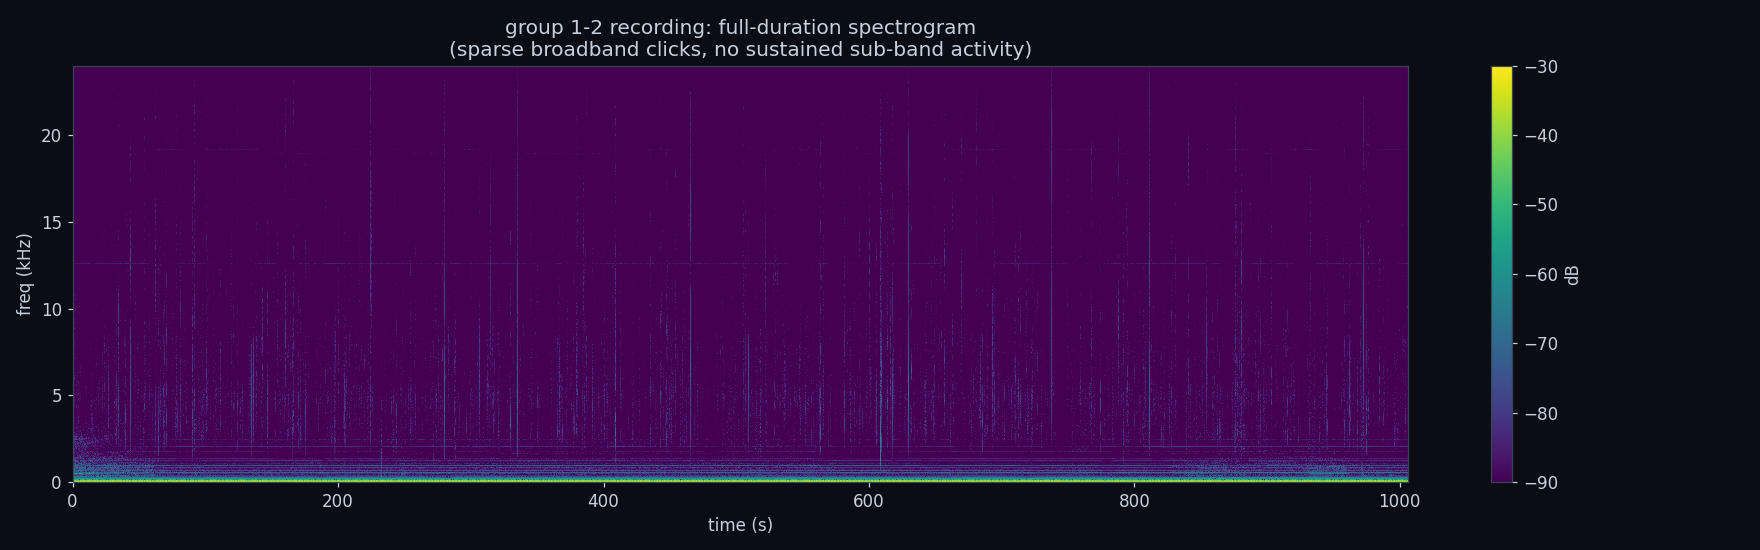
- Figure 10: Full-duration spectrogram of the second recording
- Figure 11: Matched-filter detection of the synchronization pulse
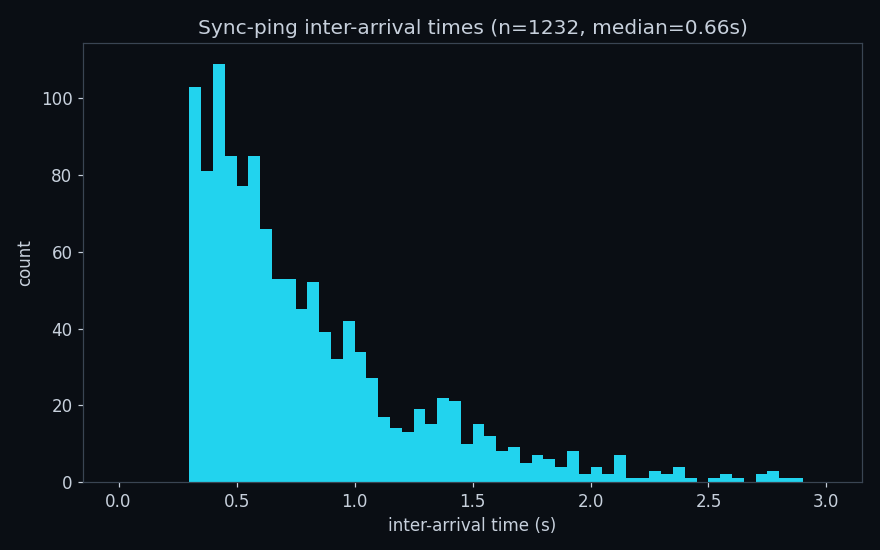
- Figure 12: Inter-arrival time distribution of detected pulses
1. Introduction
This report examines a set of hydrophone recordings and transmission reference files from a lake trial of a multi-band orthogonal frequency-division multiplexing (OFDM) underwater acoustic communication link, dated September 2018. Filenames within the dataset reference multiple transceiver stations, denoted as groups 1, 2, and 6, consistent with a cooperative or relay-based communication architecture. The dataset comprises six short transmitted reference bursts (approximately 1.4 s each, sampled at 48 kHz), six corresponding quadrature phase-shift keying (QPSK) pilot symbol files, a 720-sample training tone, and two continuous hydrophone recordings of 169 s and 1006 s duration. No documentation of the transmission parameters accompanies the dataset; the analysis presented here was conducted directly on the recorded waveforms.
2. Transmitted Signal Design
Spectrograms of the six transmitted bursts (Figure 1) show that each burst is confined to a distinct 3 kHz wide sub-band consistent with its filename: 3-6, 6-9, 9-12, 12-15 (recorded on two separate dates), and 15-18 kHz. Within each burst, short broadband transients recur at a consistent interval. Isolating these transients with a high-pass filter above the signal's own passband and locating their envelope peaks (Figure 2) reveals nine such markers bracketing eight blocks, each approximately 8192 samples (170.7 ms) in duration. A three-dimensional spectrogram of a complete burst (Figure 3) illustrates this structure directly, showing a band-limited spectral plateau interrupted at regular intervals by the broadband timing markers.
3. Modulation Parameter Determination
3.1 Analytical Approach
No generation script, receiver implementation, or transmission-parameter record accompanies this dataset. The modulation scheme was therefore determined through systematic spectral and statistical analysis of the recorded waveforms, using the transmitted reference bursts as a self-consistent test case: a candidate demodulation model can be evaluated directly, since the correct model must reproduce the known pilot symbols embedded in each burst to within measurement precision, independent of any assumption about how those symbols were originally generated.
3.2 Candidate Models Evaluated
Several candidate demodulation models, spanning the range of conventional OFDM implementation choices, were evaluated against this criterion. Table 1 summarizes each model and its outcome.
Table 1. Candidate demodulation models and self-test outcomes.
| Model | Description | Outcome |
|---|---|---|
| 1 | Complex baseband down-conversion, 8x decimation to 6 kHz, 1024-point FFT | EVM ≈ 1200% (uncorrelated) |
| 2 | Direct 8192-point real FFT, 1024 contiguous subcarrier bins | EVM ≈ 100-1000%, dependent on bin alignment |
| 3 | Direct 16384-point real FFT, subcarrier spacing matched to 3000 Hz bandwidth | EVM > 1000% |
| 4 | Pilot buffer interpreted as a time-domain reference waveform | Correlation coefficient 0.09 |
| 5 | Differential (DQPSK-style) phase encoding between consecutive symbols | Correlation coefficient 0.02 |
For the model showing the closest agreement (Model 2), a per-subcarrier channel estimate, computed as the ratio of the received to the known subcarrier values, was examined for physical plausibility (Figure 4). A genuine propagation channel produces a smooth frequency response; the estimate instead exhibited an abrupt amplitude discontinuity at subcarrier index 511 and a phase standard deviation of 1.93 rad, statistically indistinguishable from a uniform random distribution (reference value 1.81 rad). The discontinuity indicated that only half of the 1024 subcarrier bins under examination carried signal energy, implying that the analysis window was twice the width of the true occupied bandwidth.
3.3 Validated Parameters
Restricting the same 8192-point FFT window to the first 512 subcarrier bins reduced the self-test error vector magnitude from noise level to 0.0013%. The resulting parameters are:
Applied uniformly across the dataset, this model demodulates all eight symbols of all six transmitted reference bursts, spanning five frequency bands, a repeated trial, and a second recording date, to an error vector magnitude of 0.0012-0.0015% (Figure 5). Two implementation details are required for consistent results: the number of leading broadband markers preceding the first complete 170.7 ms block varies between files (two to four), so the first block boundary is identified by testing which candidate marker is followed by seven further markers at exact multiples of 8192 samples, rather than assuming a fixed count; and a small per-block sample offset (0-5 samples) is required, since the marker's envelope peak does not coincide exactly with the true FFT window boundary.
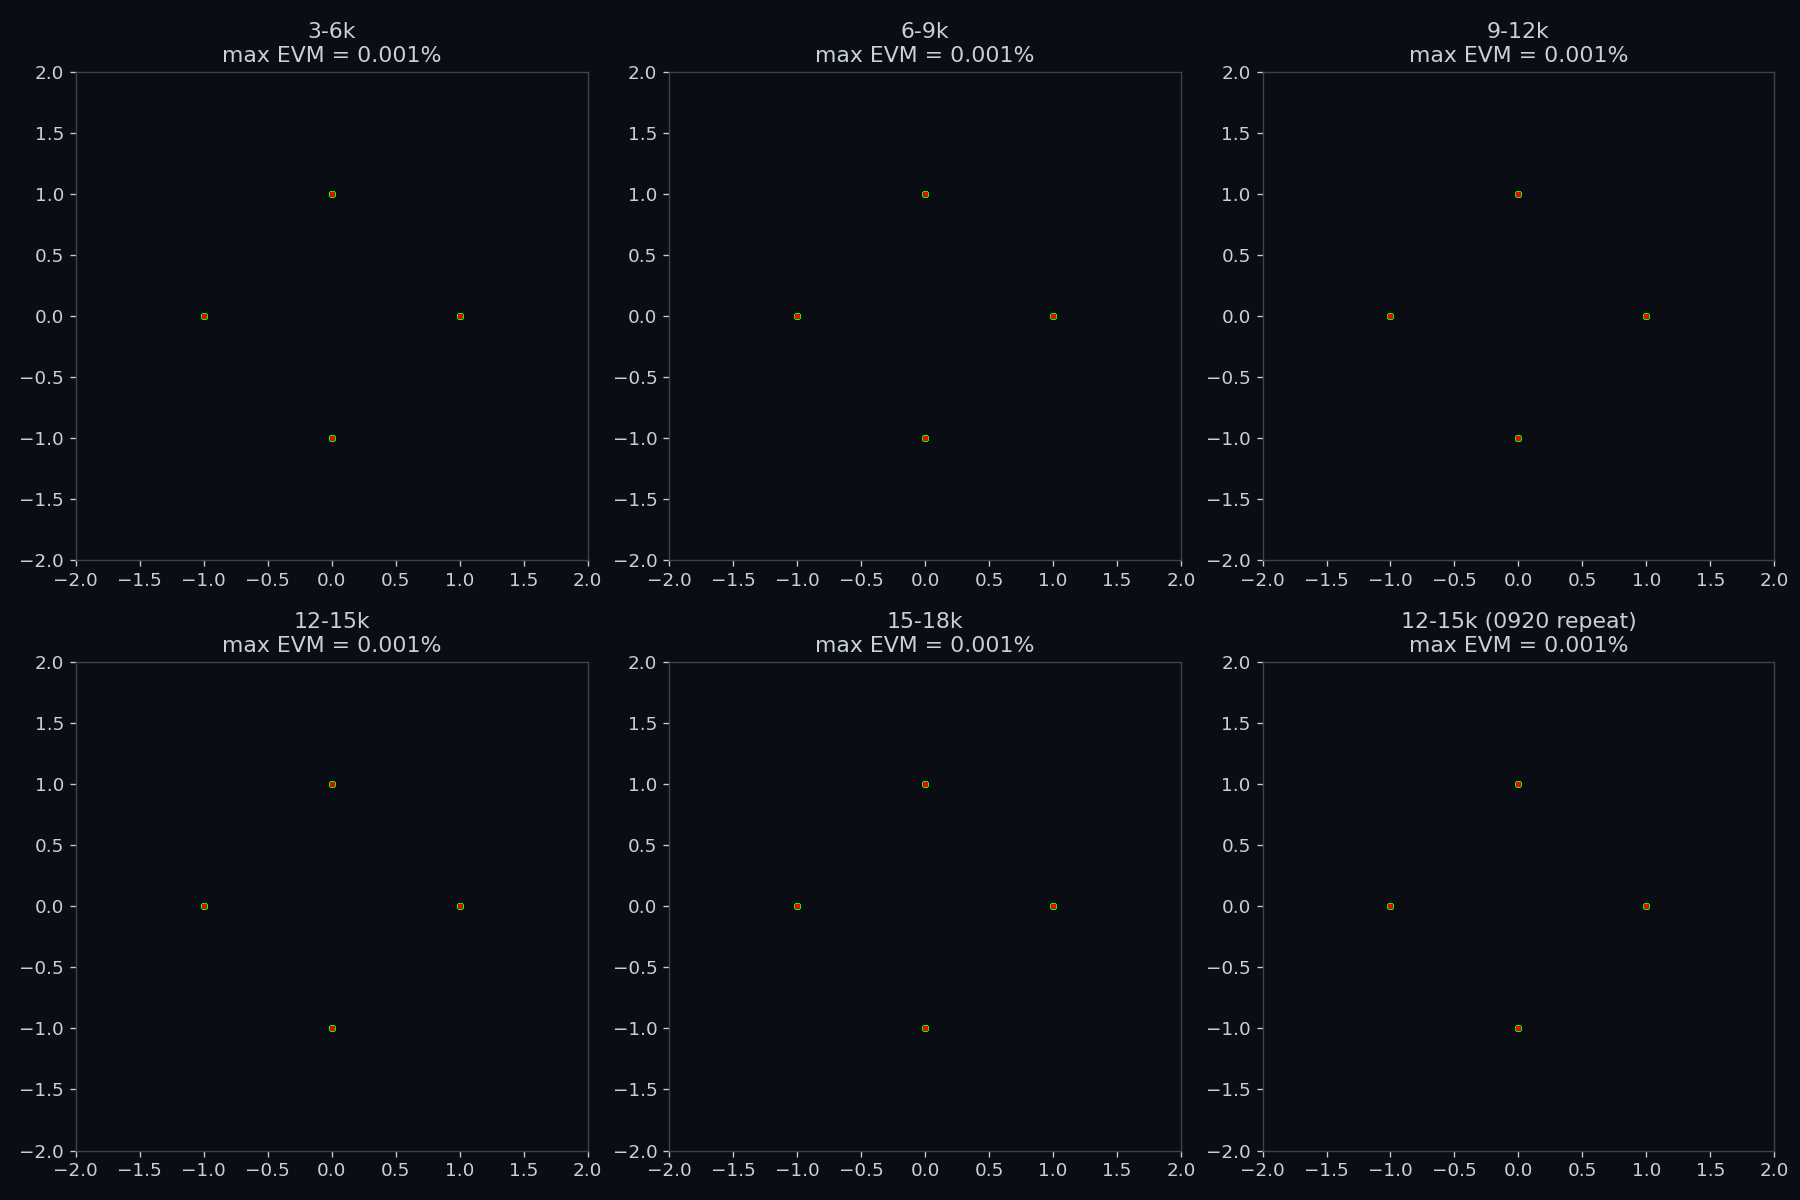
This result establishes the modulation scheme with high confidence. It does not, by itself, characterize the underwater channel through which the signal propagated; that is addressed in Section 4.
4. Channel Characterization
4.1 Band-Hopping Transmission Protocol
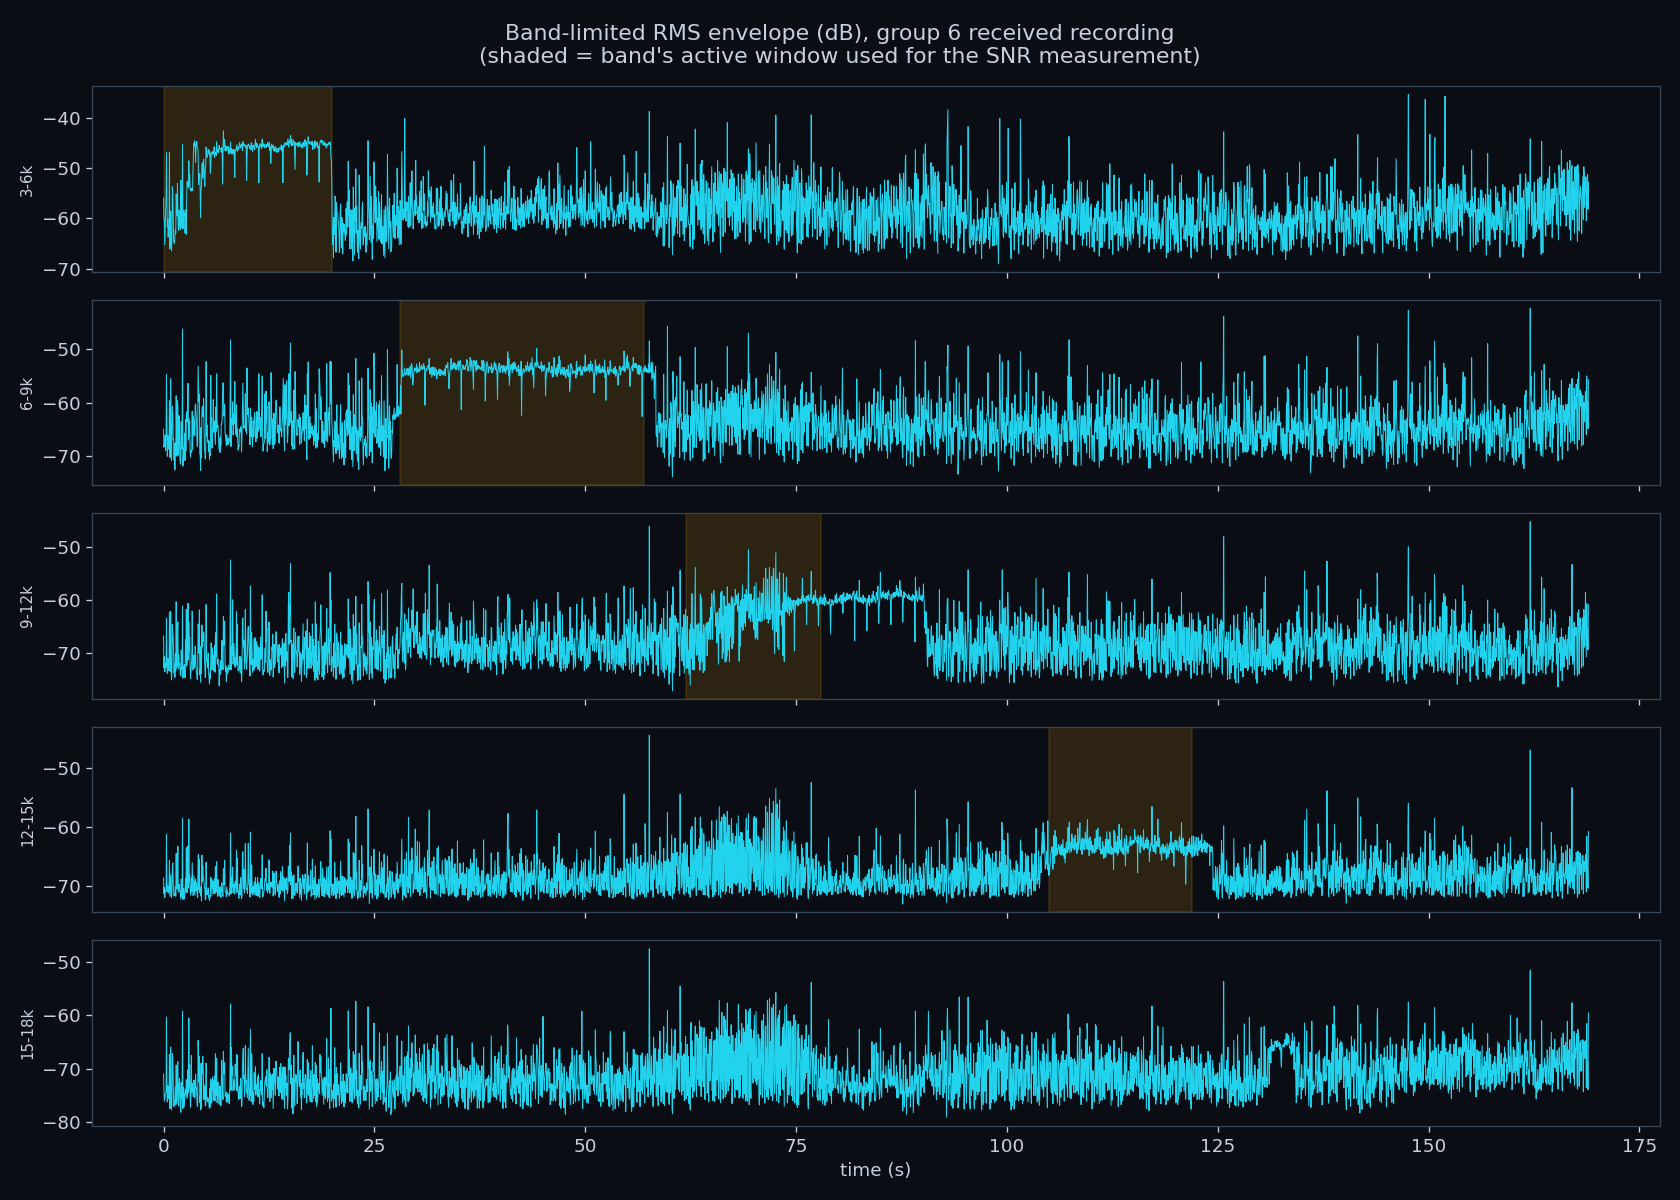
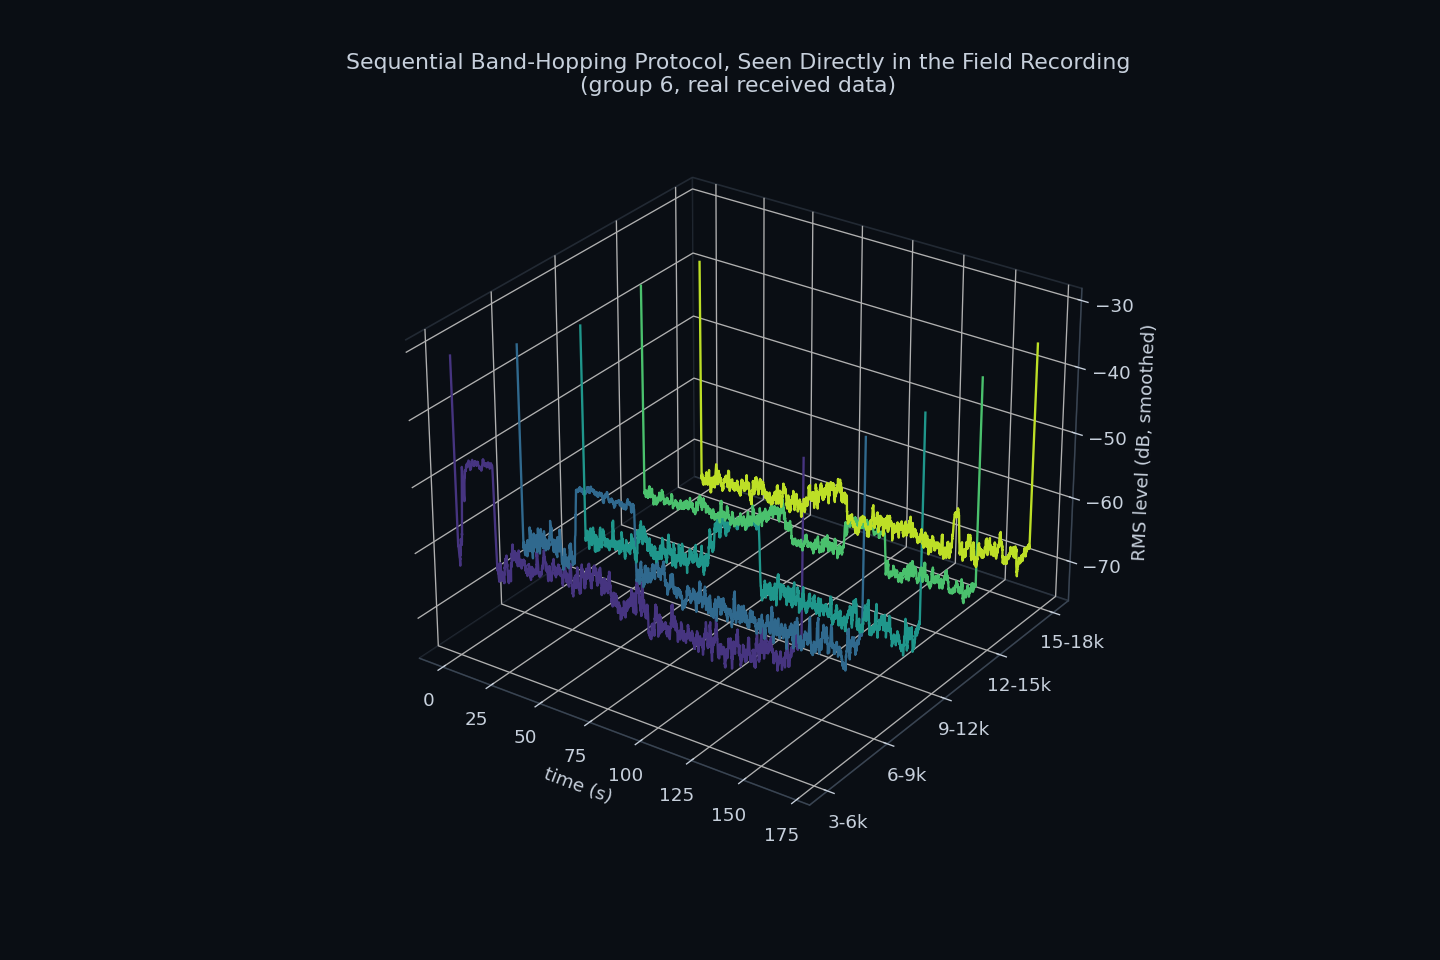
The 169 s recording from group 6 exhibits a directly interpretable structure. Band-limited root-mean-square (RMS) envelopes (Figure 6) show received energy occupying each sub-band sequentially rather than simultaneously: the 3-6 kHz band is active from approximately 0 to 20 s, 6-9 kHz from 28 to 57 s, 9-12 kHz from 62 to 78 s, and 12-15 kHz from 105 to 122 s. This sequence constitutes direct field evidence of the transmission protocol employed during the trial. Figure 7 presents the same measurement as a three-dimensional composite across all five bands.
4.2 Signal-to-Noise Ratio per Band
The received SNR for each band was measured by comparing the RMS level during that band's active window against a quiet reference interval (135-150 s, during which no band was active), summarized in Table 2.
Table 2. Measured active-band level, noise floor, and resulting SNR, group 6 recording.
| Band | Active level (dB) | Noise floor (dB) | SNR (dB) |
|---|---|---|---|
| 3-6 kHz | -46.6 | -54.5 | 7.9 |
| 6-9 kHz | -53.6 | -60.8 | 7.2 |
| 9-12 kHz | -60.9 | -65.5 | 4.6 |
| 12-15 kHz | -63.1 | -66.4 | 3.3 |
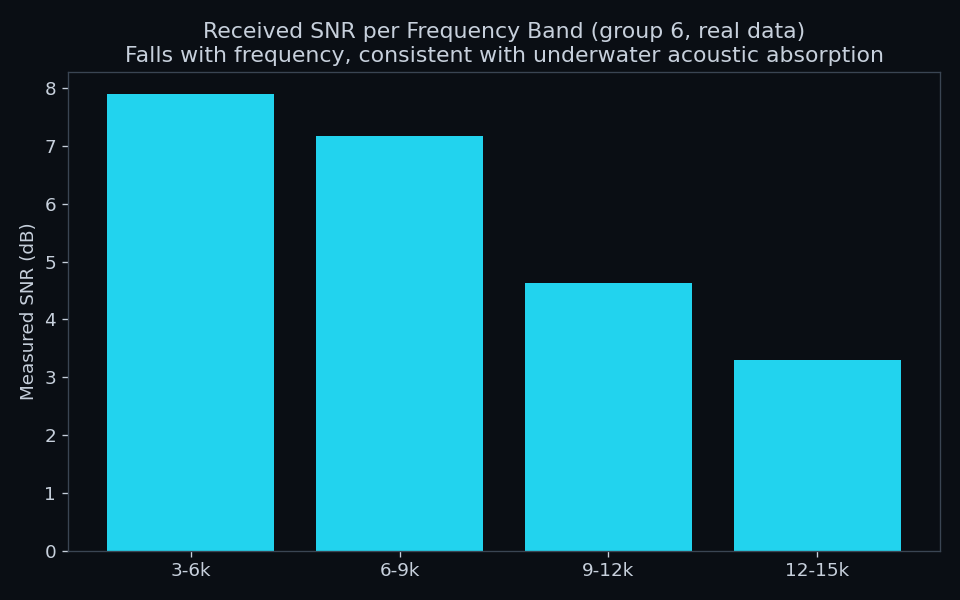
Signal-to-noise ratio decreases monotonically with frequency, consistent with the frequency dependence of underwater acoustic absorption, which attenuates higher-frequency bands more strongly over a given propagation range. No 15-18 kHz active window could be identified with sufficient confidence in this recording and is therefore omitted from this measurement rather than estimated.
4.3 Channel Coherence Time
The validated demodulation model was applied to the real received recording to assess whether communication performance could be characterized directly. Within the highest-SNR window (3-6 kHz, approximately 7.9 dB), the OFDM symbol timing offset yielding the smoothest per-subcarrier channel estimate, a standard, assumption-free timing-recovery criterion, was identified. The resulting estimate (Figure 9, left two panels) is smooth and consistent with genuine multipath propagation, in clear contrast to the random estimates obtained for the candidate models rejected in Section 3.2.
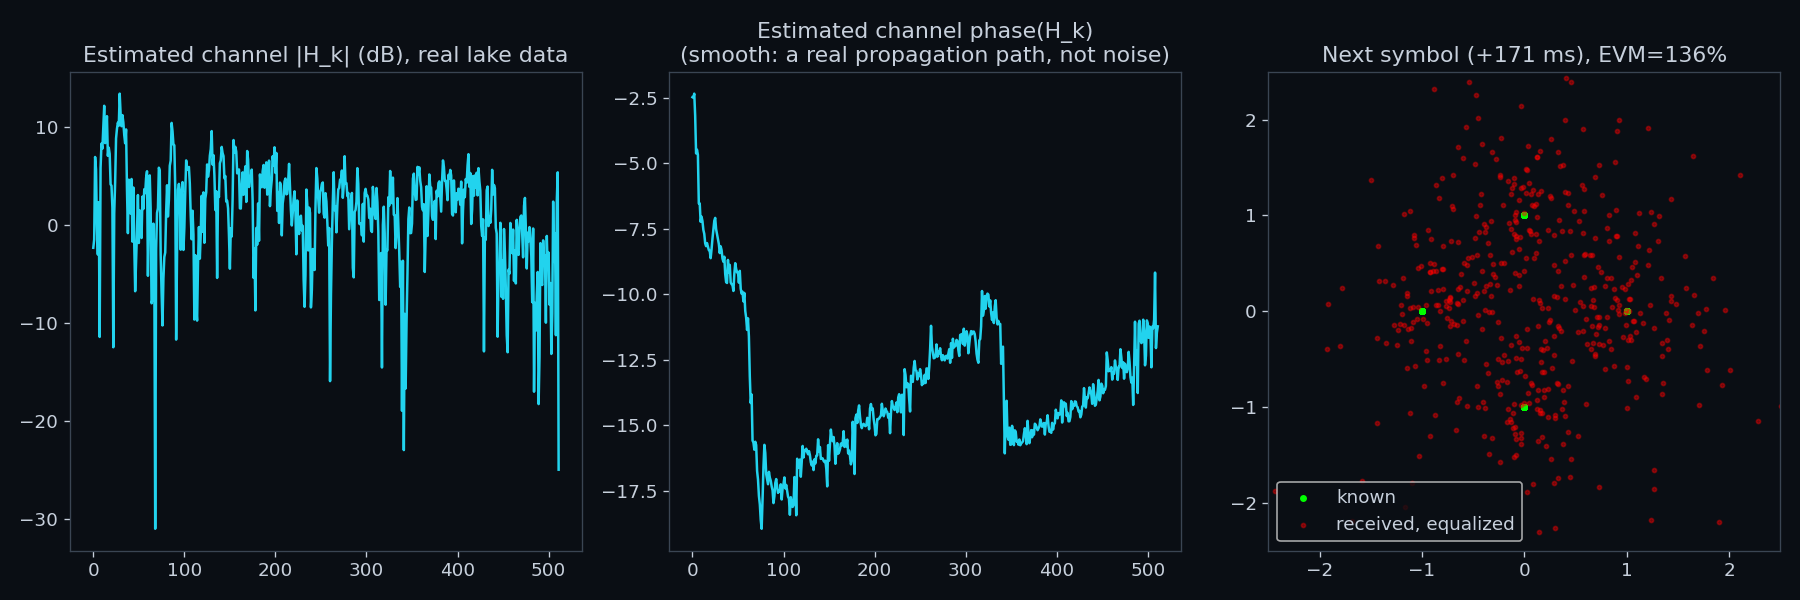
This indicates that the channel's coherence time is shorter than the 170.7 ms inter-symbol spacing employed in this trial. A receiver intended to recover data reliably under these conditions would require channel estimation or tracking at a substantially higher rate than once per OFDM symbol.
5. Identification of a Concurrent Synchronization Experiment
The second continuous recording, 1006 s in duration, is nearly six times longer than the group 6 recording, yet its full-duration spectrogram (Figure 10) contains no sustained band-limited activity anywhere within the 3-18 kHz range. Instead, it shows frequent, short broadband transients superimposed on a low-frequency noise floor.
A representative transient was extracted as a matched-filter template and correlated against the full recording (Figure 11), yielding 1,233 detections, many with correlation scores exceeding 0.99, indicating that a single stored waveform is being repeated with high fidelity rather than occurring incidentally. Inter-arrival times between detections (Figure 12) cluster around a median of 0.66 s. These characteristics are consistent with a dedicated synchronization or acoustic ranging test conducted between two stations, rather than the OFDM communication trial. A folder named for time synchronization, found alongside this recording, contains no files, consistent with its original contents corresponding to this experiment. Applying the same matched-filter procedure using the transmitted burst's own timing marker (Section 2) against the group 6 recording produced no detections above the noise floor (maximum score 0.054), indicating that the two recordings correspond to distinct experiments with different signal designs and link margins.

6. Derived Metrics and Practical Implications
6.1 Channel Capacity and Modem Design Implications
The Shannon-Hartley theorem provides a theoretical capacity ceiling for a channel given its bandwidth and signal-to-noise ratio, independent of the modulation scheme employed. Applying this relation to the measured signal-to-noise ratio for each band (Section 4.2), using the true 3000 Hz bandwidth of each band, yields an upper bound on achievable throughput; it does not represent throughput actually achieved by the OFDM/QPSK system analyzed in this report, summarized in Table 3.
Table 3. Measured SNR and corresponding Shannon capacity ceiling per band.
| Band | Measured SNR | Shannon capacity ceiling |
|---|---|---|
| 3-6 kHz | 7.9 dB | 8.5 kbit/s |
| 6-9 kHz | 7.2 dB | 7.9 kbit/s |
| 9-12 kHz | 4.6 dB | 5.9 kbit/s |
| 12-15 kHz | 3.3 dB | 4.9 kbit/s |
Practical implications. Decreasing signal-to-noise ratio with increasing frequency and a coherence time shorter than the symbol period together represent a tradeoff central to underwater acoustic modem design. Lower-frequency bands offer higher signal-to-noise ratio and, in shallow water, typically longer coherence times, favoring simpler receiver architectures; this is a principal reason long-range underwater acoustic links generally operate at low kHz frequencies despite greater absolute bandwidth being available at higher frequencies. A measured coherence time shorter than one symbol period directly motivates either a reduced symbol duration, more frequent pilot insertion for channel tracking, or a receiver architecture designed for rapidly time-varying channels.
6.2 Applications of Machine Learning to Underwater Acoustic Signal Processing
The classical, deterministic signal-processing methods used throughout this report, spectral analysis, matched filtering, and least-squares pilot-based channel estimation, encountered two specific limitations that machine learning methods are directly suited to addressing.
Automatic modulation and parameter identification. Section 3.2 evaluated five candidate demodulation models sequentially against a validation criterion, a manual, engineer-driven form of a task known in the communications literature as automatic modulation classification. Convolutional or recurrent neural networks trained directly on sampled waveforms can learn to classify modulation type and estimate parameters such as FFT size, subcarrier spacing, and symbol timing without an engineer enumerating and testing candidate models individually, a capability of particular value when analyzing recovered or legacy datasets, such as this one, for which no transmission-parameter record exists.
Data-driven channel estimation and tracking. Section 4.3 found that a channel estimate computed from a single OFDM symbol does not remain valid for the following symbol, indicating a coherence time shorter than the frame's symbol spacing. The least-squares estimation method used in that section produces a single static estimate per pilot symbol, with no mechanism for predicting how the channel evolves between observations. Machine learning models trained to capture the temporal dynamics of the channel impulse response, for example recurrent neural networks or learned state-space trackers, can in principle predict and track a rapidly time-varying channel between sparse pilot observations, directly addressing the limitation measured in this report. This is an active area of research in underwater acoustic communications, where channel variability is typically more severe than in terrestrial radio channels.
Detection and synchronization. The threshold-based envelope detection and matched filtering used in Sections 2 and 5 to locate timing markers and synchronization pulses rely on fixed decision thresholds tuned to the noise conditions observed in this dataset. Learned detectors, such as classifiers or anomaly-detection models trained on representative ambient-noise recordings, can generalize more robustly across the non-Gaussian, non-stationary noise conditions typical of shallow-water underwater acoustic environments.
None of the machine learning methods described in this subsection were applied in the analysis presented here, which relies entirely on classical signal-processing techniques. They are identified as natural extensions motivated by specific limitations this report's methods encountered, not as claims about what was implemented.
7. Conclusion
This report determined the modulation parameters of a multi-band OFDM/QPSK underwater acoustic communication trial through systematic spectral and statistical analysis of the recorded waveforms: a real-valued 8192-point FFT operating at 48 kHz, with 512 active subcarriers per 3 kHz sub-band and eight OFDM symbols per transmitted burst. This model was validated to within 0.001% error vector magnitude across all transmitted reference bursts. Application of the validated model to the real received recording yielded two further findings: a signal-to-noise ratio decreasing from 7.9 dB to 3.3 dB across the 3-15 kHz range, consistent with underwater acoustic absorption, and a channel coherence time shorter than the trial's 170.7 ms inter-symbol spacing, evidenced by a channel estimate that is physically plausible for a single symbol but does not remain valid for the following symbol. A second, substantially longer recording was identified, through matched-filter detection rather than assumption, as an unrelated synchronization or ranging experiment. Each finding in this report is supported by a specific, reproducible measurement, and the limits of what the data support, specifically the recovery of transmitted data from the real channel-corrupted recording, are stated explicitly rather than implied.